Tuesday, November 17, 2009

Nip2 - the advanced images analysis tool

The nip2 is a unique images analysis tool - it is not a conventional graphical editor like Adobe Photoshop or The GIMP.

The nip2 approach: each processing result is a cell
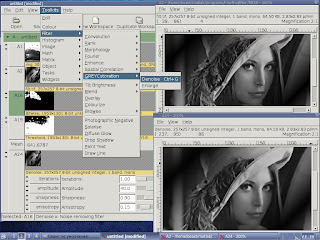
Nip2 has a non-trivial yet productive interface that is a kind of mix between a spreadsheet and a graphical editor (imagine a cocktail with Photoshop and Excel). The result of any operation is put down into a cell and you can make references to any cell (that is an image after some processing operation). For example, you can select the area of interest (cell A2) on the original image (cell A1) and apply some filter to region of interest that will be A3 cell. Such an interface allows you to quickly recalculate the resulting image if any parameters of previous filters have been changed.
The screenshot illustrates such paradigm.


Hence the nip2 is not a conventional graphical editor but rather a graphical analyser. Nip2 supports the most useful graphical formats such as TIFF, JPEG, PNG, PPM, as well as scientific formats like MAT (MATLAB's matrices) and convolution matrices. Thanks for using VIPS library, the nip2 allows to view extremely large images very fast: you definitely appreciate such feature is you process scientific data.

What is expected to find in NIP2 and what is not
To reiterate, the nip2 is rather a scientific images analysis laboratory than just another raster images editor. So there are no tools for layers and masking (and such tools are not needed). But when one deals with large images such as panorama, nip2 is priceless. Moreover, there are many advanced images processing algorithms that are hardly to be found in conventional editors: morphological images analysis, Fourier transform, statistical tools, and many other.

Few words about the interface of nip2
As above, the spreadsheet-like paradigm of nip2's interface allows you to change filter's parameters and quickly recalculate the resulting image. I'm going to show this on an example.
For instance, there is a sequence of filters that you need to apply on image
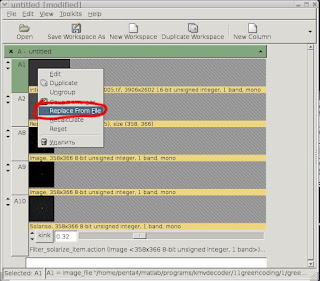
- changing one parameter results on the destination image. Then you need to apply the filtering sequence for another image - and here the nip2 to rescue you: just right-click on any cell in nip2 and select "Replace from file".
That is enough for recalculation of the whole filtering sequence.


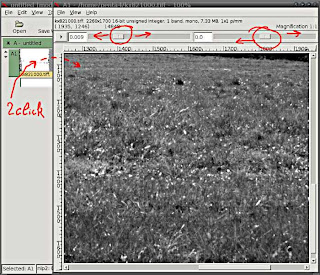
Intensity-scale change for images viewing
This is a very helpful feature when you need to view an image with specific grey levels (e.g., 12-bit raw images from the digital camera).

In order to change the intensity scale of the image, just left-drag to set number of brightness or contrast magnification. It does not affect on the real image's values but just for viewing.


Quick zooming
If you need to zoom-in or out quickly, just hold CTRL button on the keyboard and turn mouse's wheel.


Hotkeys in в nip2

The assignment of the hotkey for any menu function is really easy: just open nip2's menu, select the item and (when the item is selected) press a hotkey combination. The hotkey combination for that function will be assigned instantly.


Fast region selection
If you need to select the region of interest on the image, just hold CTRL keyboard button and start selecting the area on the image. A new cell that contains the selected appears instantly in the current column and the next number (e.g., if the current column is B and the last number of cell is 14, cell B15 with the region appears).


Quick scrolling of the image
Use the wheel, Luke! When viewing the image in the window, one can scroll the image up-down using mouse wheel. Moreover, holding SHIFT button and scrolling moves viewing area left and right, so you can completely neglect scrollbars.


Images analysis in nip2

Using nip2, one can perform advanced images processing and analysis by such tools as Fourier transform, correlation analysis, filtering and morphological analysis. The most common examples that I use daily have been provided below.

Fourier analysis in nip2
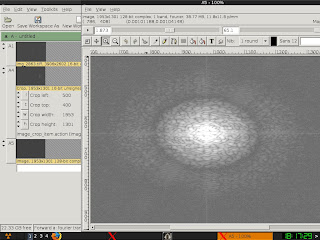
In many cases it is necessary to look not only on the image but on its Fourier spectrum. In contrast with conventional images editors, there are no problems in nip2: just use Toolkits - Math - Fourier - Forward and enjoy. You should nonetheless take into account that for large images Fourier transform can take a long time (~10-15 seconds depends on CPU's horsepower).

The reverse Fourier can be performed likewise using Toolkits - Math - Fourier - Reverse .


Images' histograms in nip2
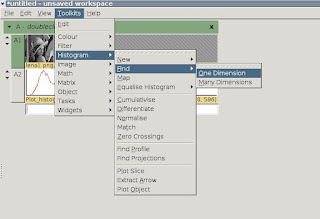
A histogram can deliver the information about how much pixels of the same level contains the image being analysed. Indeed, this is a very useful feature, and you can find it in Toolkits - Histogram - Find - One Dimension.

As a result, we have a beautiful and informative histogram for the image.


Images edition in nip2
Of course you can edit and transform images in nip2 but some of the functions can look like kind a philosophical.

Cropping
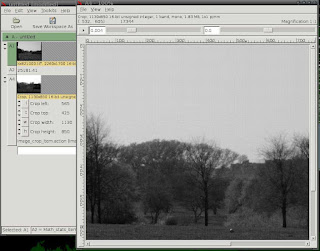
There are two ways to crop the image: use Toolkits - Image - Crop or just open the cell with the image and select the region of interest.

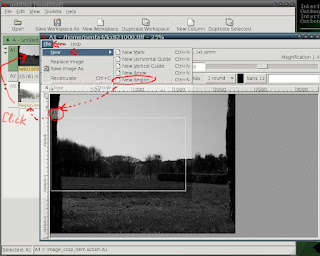
Or, using menu one can select the region of interest likewise: File - New - New Region.


After that, you can save the cropped image by right-click and select "Save image as".


Threshold
The threshold function is concealed in the menu in Toolkits - Image - Select - Threshold.

Joining images in nip2
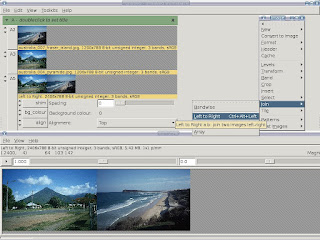
One of the most exciting feature of nip2 is joining images. While Photoshopers and Gimpers are buying heaps of RAM for their computers, nip2 users can join large images easily. Just use Toolkits - Image - Join - Left to Right or Toolkits - Image - Join - Top to Bottom and what we have:

This is much more easy and way faster than in Photoshop or Gimp: I have glued together 10x10 images each of which is 3000x2000 pixels on a notebook computer with only 512Mb RAM.


Tilt brightness
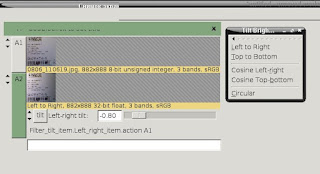
It happens sometime, and brightness tilt is very boring effect (i.e., when you analysing images from microscope, it is difficult to capture it without such brightness artefacts). But using nip2, one can correct tilt brightness using Tools - Filters - Tilt brightness.
Such function restores correct illumination on the image (to some extent, of course).

Conclusion
This post is actually a collection of my favorite tips and tricks of work in nip2. I'm going to update this post from time to time. And, of course, I would like to thank
John Cupitt, Kirk Martinez, and Joe Padfield for such a great program!

Thursday, November 12, 2009

Optical discs with large information capacity... and where they actually are!?

I have received recently OPN Optics & Photonics News journal and read a small reference to recent advance in large-capacity discs. In particular, Australian researchers at Swinburne University of Technology (Hawthorn, Victoria, Australia) have proposed a new type of optical disc that can store 1.6 terabytes of data.

Developed by professor Min Gu and colleagues, the technology uses the unique properties of surface plasmons in gold nanorods to take advantage of information in five dimensions: the three spatial domains, wavelength and polariza­tion. The nanorods, which are coated in polyvinyl alcohol and mounted on a glass substrate, can be selectively recorded in layers by laser light, due to their unique optical and photothermal properties. Min Gu and his team have recorded ten layers and believe up to 100 may be feasible, for a potential disk capacity of 7.2 ТВ.

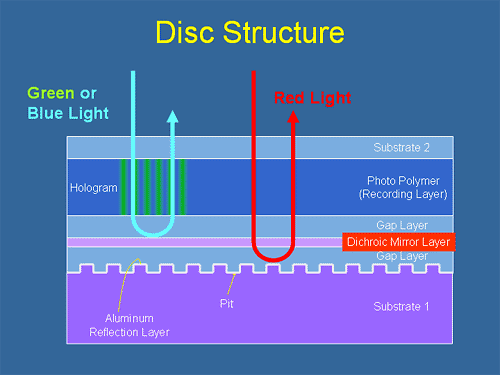
We all hope that such discs can be used not only by military/financial institutions but for average users, too. Unfortunately, large-capacity discs are tend to demand highly precise equipment, or very special materials, or something else that makes a mass-production difficult or even impossible. Again, such researches are very promising, but for most of these projects are not commercially successful. For instance, many of us remember the Holographic Versatile Disc by Optware. There were many promising ideas, hopes and dreams, but in the end - the only one wiki's page...


Fig.1 Optware's Holographic Versatile Disc™ (HVD™) disc structure.


Fig.2 Read / Write system


Fig.3 Holographic Versatile Disc™ (HVD™) on which digital movies were recorded (left). The disc diameter of 12 centimeters is equivalent to those of CD and DVD.

Thursday, September 10, 2009

EMVA1288 Standard

The European Machine Vision Association Standard 1288 is designed for unification of description digital photocameras and photosensors' characteristics. This is an open standard that provides a framework for estimation of camera's characteristics. The EMVA1288 standard is build modularly and contains all necessary recommendations and comprehensive mathematical formulation of how to measure and estimate photosensor's characteristics.

Every module of EMVA1288 Standard consists of mathematical model, the experimental setup, calculation steps and recommendations of how to publish the results of measuring. Currently (version 2.01A) there are two modules for the EMVA1288 standard: Module 1 "Characterizing the Image Quality and Sensitivity" and Module 2 "Linearity and Linearity Error".

In the Module 1 "Characterizing the Image Quality and Sensitivity of Machine Vision Cameras and Sensors", the procedure of how to characterize the temporal and spatial noise of a camera and it's sensitivity to light is described.

In the Module 2 "Linearity and Linearity Error" is described the method of estimation of area and linescan sensors/cameras for which the output signal is expected to be directly proportional to the impinging photon flux (exposure). Although this module is optional, it may be useful for estimation of the real dynamic range of the photo sensor.

The EMVA1288 Standard was re-typesetted in LaTeX format as the more appropriate format for scientific use. The latest LaTeX version of the EMVA1288 Standard can be downloaded from these mirrors:
As for concluding remark, I can additionally say that EMVA1288 Standard is useful not only for machine-vision cameras but for consumer-grade cameras, too. RAW data from the consumer-grade cameras, after appropriate conversion by such software as dcraw, can be used for characterisation of consumer-grade camera as a measuring device.

Tuesday, April 28, 2009

Brief note about LCD displays

Liquid crystal was discovered by the Austrian botanist Fredreich Rheinizer in 1888. ``Liquid crystal'' is neither solid nor liquid (an example is soapy water). Liquid crystals are almost transparent substance; the light passes through liquid crystals is being polarized according to orientation of molecules. Such property belongs to solid state substances, namely crystals. The orientation of molecules changes when voltage is applied to the liquid crystals.

The main idea of LCD displays is to attenuate the brightness by polarisation plane's change. When liquid crystal is placed between two polarisers [1], whose polarisation planes have 90$ ^{\circ}$ angle, one can change transparency of the liquid crystals by application of different voltage (see Fig.1). Typical pixel pitch is about 200-300 micrometers.

How to make control the LCD

The segment drive method is used for simple displays, such as those in calculators, while the dot-matrix drive method is used for high-resolution displays, such as those in portable computers and TFT monitors.

Two types of drive method are used for matrix displays. In the static, or direct, drive method, each pixel is individually wired to a driver. This is a simple driving method, but, as the number of pixels is increased, the wiring becomes very complex. An alternative method is the multiplex drive method, in which the pixels are arranged and wired in a matrix format.

To drive the pixels of a dot-matrix LCD, a voltage can be applied at the intersections of specific vertical signal electrodes and specific horizontal scanning electrodes. This method involves driving several pixels at the same time by time-division in a pulse drive. Therefore, it is also called a multiplex, or dynamic, drive method.

How to make colour on LCD

Each pixel is divided into three section - for red, green, and blue part (there is a separate light filter on each one). Degree of angle's rotation of LCD molecules is almost linear to applied voltage in definitive range of voltage. Hence we can obtain about 64 levels of brightness on each element, or 262 144 (18 bit) per pixel of three colour filters.

Inversion

In liquid crystal pixel cells, it is only the magnitude of the applied voltage which determines the light transmission (the transmission vs. voltage function is symmetrical about 0V). To prevent polarisation (and rapid permanent damage) of the liquid crystal material, the polarity of the cell voltage is reversed on alternate video frames.

First scheme is full-frame inversion, when the voltage of each next frame has different polarity (the most simple scheme yet has a drawback of flickering and crosstalk). Second scheme is row inversion - the advantage is absence of crosstalk between neighbour pixels. Third scheme is column inversion. The last and the most tricky is pixel-by-pixel inversion, when the pixel's voltage changes its polarity according to the one of neighbour pixels polarity (the most complicated and hence energy-consuming). Unfortunately it is very difficult to get exactly the same voltage on the cell in both polarities, so the pixel-cell brightness will tend to flicker to some extent at half the frame-rate. If the polarity of the whole screen were inverted at once then the flicker would be highly objectionable. Instead, it is usual to have the polarity of nearby pixels in anti-phase, thus cancelling out the flicker over areas of any significant size. In this way the flicker can be made imperceptible for most ``natural'' images.

Cross-talk

Owing to the way rows and columns in the display are addressed, and charge is pushed around, the data on one part of the display has the potential to influence what is displayed elsewhere. This is generally known as cross-talk, and in matrix displays typically occurs in the horizontal and vertical directions. Cross-talk used to be a serious problem in the old passive matrix (STN) displays, but is rarely discernable in modern active-matrix (TFT) displays. For most practical purposes, the level of crosstalk in modern LCDs is negligible. Certain patterns, particularly those involving fine dots, can interact with the inversion and reveal visible cross-talk. If you try moving a small Window in front of the inversion pattern (above) which makes your screen flicker the most, you may well see cross-talk in the surrounding pattern.

Refresh time

is the rate at which the electronics in the monitor addresses (updates) the brightness of the pixels on the screen (typically 60 to 75Hz). For each pixel, an LCD monitor maintains a constant light output from one addressing cycle to the next (sometimes referred to as ``sample-and-hold''), so the display has no refresh-dependent flicker. There should be no need to set a high refresh rate to avoid flicker on an LCD.

Response time

The transmittance of the LCD pixel is changing according to applied voltage. But any liquid crystal is characterized by viscosity so it takes a time to change orientation of molecules. LCD displays' manufacturers traditionally measures the least time of the monitor's response, namely switch time from black 90% to white 10%. Such measuring technique does not tells anything about real switching time because it is more likely for monitor to switch brightness of pixels gradually. So the molecules need to rotate on smaller angle; but rotation speed is proportional to voltage. Hence switching from black to white is always faster than switching from black to grey.

LCD matrix technology

Higher-priced LCDs (probably using ``In-Plane Switching'' liquid crystal modes) should have colours which are less affected by viewing angles for that application (IPS tends to have a less-good black-state-lower contrast- however). ``Vertically Aligned'' (Multidomain -VA) boast the darkest blacks, equivalently highest contrast, of any LCD technology, but response time and viewing angle are poorer than IPS.

TN+Film-matrix

TN-matrices (additional ``Film'' word means scattering film), ``Twisted Nematic'' - when the voltage is applied, molecules are twisted; the polarisation axis in this case is perpendicular to the one of panel's. (Fig.1.1.1). When no voltage is applied, TN matrix allows the light to pass through both polarisers. That is one of features of TN matrices: when the pixel is damaged, a bright dot appears on the screen.

IPS-matrix

In-Plane Switching - liquid crystals in cells of IPS-panel are located in the same plane and always parallel to the panel's plane (see Fig.1.1.2). When voltage is applied to the pixel, the pixel passes the light through; if not, no light passes. That is why the damaged pixel remains black (in contrast with TN+Film, where damaged pixel passes light) [2]. Both electrodes are located in the same plane, hence the area of electrodes is greater than for TN+Film matrices. Such circumstance leads to decrease of contrast and brightness of the matrix as well as to deterioration of switching speed (about 35 ms). The advantage of IPS matrix is better angles of views than TN+Film and the best colour reproduction. The specific feature is the colour of black: when you look at the IPS monitor aside, the black colour seems a little bit purple.

There were developed several technologies based on IPS such as Super-IPS (S-IPS), Dual Domain IPS (DD-IPS) and Advanced Coplanar Electrode (ACE), A-SFT, A-AFT, SA-SFT, and SA-AFT.

MVA- и PVA- matrix

MVA (Multidomain Vertical Alignment) - it is something easier to draw than to explain (see Fig.1.1.3 fully opened pixel) [3]. The MVA pixel is divided into domains that are rotating synchronously. Liquid crystals are aligned differently in domains (Fig.1.1.3). So there is practically no difference from which side a user looks on the monitor: crystals in different domains are aligned in different angles. As for IPS, damaged pixels looks like a black dot [4].

PVA - Patterned Vertical Alignment - is like a MVA; domains of different orientation of molecules in one pixel allow to reproduce the colour almost independently from view angle.

Bibliography


1
Shin-Tson Wu Fellow IEEE Qi Hong Ruibo Lu, Xinyu Zhu and IEEE Thomas X. Wu, Senior Member.
Ultrawide-view liquid crystal displays.
JOURNAL OF DISPLAY TECHNOLOGY, 1:1, SEPTEMBER 2005.
2
MASAHITO OH-E* and Hitachi Ltd. 7-1-1 Ohmika-cho Hitachi-shi Ibaraki-ken 319-12 Japan KATSUMI KONDO, Hitachi Research Laboratory.
The in-plane switching of homogeneously aligned nematic liquid crystals.
Liquid Crystals, 22:379-390, 1997.
3
Ivan I. Smalyukh Mingxia Gu and Liquid Crystal Institute Kent State University-Kent Ohio 44242 Oleg D. Lavrentovich, Chemical Physics Interdisciplinary Program.
Directed vertical alignment liquid crystal display with fast switching.
APPLIED PHYSICS LETTERS, 88, 2006.
4
Kenji okamoto Yoshio Koike.
Super high quality mva-tft liquid crystal displays.
Fujitsu Sci. Tech., 35:221-228, 1999.
Parts of the text are courteously from techmind.

Thursday, March 19, 2009

Small survey of Objective Image Quality metrics

PDF version of this post is here
The importance of objective quality metric methods cannot be underestimated: such methods are being used in automated images restoration algorithms, for comparison of images compression algorithms and so on. Quality metrics are graphically presented in Fig. 1.

All proposed quality metrics can divided to two general classes1: subjective and objective [2].

Subjective evaluation of images quality is oriented on Human Vision System (HVS). As it was mentioned in [3], the best way to assess the quality of an image is perhaps to look at it because human eyes are the ultimate receivers in most image processing environments. The subjective quality measurement Mean Opinion Score (MOS) has been used for many years.

Objective metrics include Mean Squared Error (MSE), or $L_p$-norm [4,5], and measures that are mimicking the HVS such as [6,7,8,9,10,11]. In particular, it is well known that a large number of neurons in the primary visual cortex are tuned to visual stimuli with specific spatial locations, frequencies, and orientations. Images quality metrics that incorporate perceptual quality measures by considering human visual system (HVS) were proposed in [12,13,14,15,16]. Image quality measure (IQM) that computes image quality based on the 2-D spatial frequency power spectrum of an image was proposed in [10]. But still such metrics have poor performance in real applications and widely criticized for not correlating well with perceived quality measurement [3].

As a promising techniques for images quality measure, Universal Quality Index [17,3], Structural SIMilarity index [18,19], and Multidimensional Quality Measure Using SVD [1] are worth to be mentioned 2.

Figure 1: Types of images quality metrics.

So there are three objective methods of images' quality estimation to be discussed below: the UQI, the SSIM, and MQMuSVD. Brief information about main ideas of those metrics is given. But first of all, let me render homage to a mean squared error (MSE) metric.


A Good-Old MSE

Considering that $x={x_i | i = 1,2,\dots N}$ and $y={x_i | i = 1,2,\dots N}$ are two images, where N is the number of image's pixels, the MSE between these images is:
Of course, there is more general and well-suitable formulation of MSE for images processing given by Fienup [5]:
(2)
where
(3)
Such NRMSE metrics allows to estimate quality of images especially in various applications of digital deconvolution techniques. Although Eq. 2 is better than pure MSE, the NRMSE metric have been criticizing a lot.

As it was written in remarkable paper [19], the MSE is used commonly for many reasons. The MSE is simple, parameter-free, and easy to compute. Moreover, the MSE has clear physical meaning as the energy of the error signal. Such an energy measure is preserved after any orthogonal linear transformation, such as Fourier transform. The MSE is widely used in optimization tasks and in deconvolution problem [21,22,23]. Finally, competing algorithms have most often been compared using the MSE or Peak SNR ratio.

But problems arising when one is trying to predict human perception of image fidelity and quality using MSE. As it was shown in [19], the MSE is very similar despite the differences in image's distortions. That is why there were many attempts to overcome MSE's limitations and find a new images quality metrics. Some of them are briefly discussed below.

Multidimensional Quality Measure Using SVD

The new metric of images quality called ``Multidimensional Quality Measure Using SVD'' was proposed in [1]. The main idea is that every real matrix A can be decomposed into a product of 3 matrices A = USVT, where U and V are orthogonal matrices, UTU = I, VTV = I, and $S = diag (s_1, s_2, \dots)$. The diagonal entries of S are called the singular values of A, the columns of U are called the left singular vectors of A, and the columns of V are called the right singular vectors of A. This decomposition is known as the Singular Value Decomposition (SVD) of A [24]. If the SVD is applied to the full images, we obtain a global measure whereas if a smaller block is used, we compute the local error in that block:
$s_i$ are the singular values of the original block, $\hat{s}_i$ are the singular values of the distorted block, and N is the block size. If the image size is $K$, we have $(K/N) \times (K/N)$ blocks. The set of distances, when displayed in a graph, represents a ``distortion map''.


A universal image quality index (UQI)

As a more promising new paradigm of images quality measurements, a universal image quality index was proposed in [17]. This images quality metric is based on the following idea:
The main function of the human eyes is to extract structural information from the viewing field, and the human visual system is highly adapted for this purpose. Therefore, a measurement of structural distortion should be a good approximation of perceived image distortion.
The key point of the new philosophy is the switch from error measurement to structural distortion measurement. So the problem is how to define and quantify structural distortions. First, let's define a necessary mathematics [17] for original image X and test image Y . The universal quality index can be written as [3]:
(5)
where

The first component is the linear correlation coefficient between x and y, i.e., this is a measure of loss of correlation. The second component measures how close the mean values are between x and y, i.e., luminance distortion. The third component measures how similar the variances of the signals are, i.e., contrast distortion.


UQI quality measurement method is applied to local regions using sliding window approach. For overall quality index to be obtained, average value of local quality indexes $Q_i$ must be calculated:

  
(6)

As it mentioned in [17], the average quality index UQI coincides with the mean subjective ranks of observers. That gives to researchers a very powerful tool for images' quality estimation.

Structural SIMilarity (SSIM) index

The Structural Similarity index (SSIM) that is proposed in [18] is a generalized form of a Universal Quality Index [17]. As above, $x$ and $y$ are discrete non-negative signals; $\mu_x$, $\sigma_{x}^2$, and $\sigma_{xy}$ are the mean value of $x$, the variance of $x$, and the covariance of $x$ and $y$, respectively. According to [18] the luminance, contrast, and structure comparison measures were given as follows:


(7)


(8)


(9)
where $C_1$, $C_2$ and $C_3$ are small constants given by $C_1 = (K_1\cdot L)^2$ ; $C_2 = (K_2 \cdot L)^2$ and $C_3 = C_2/2$. Here $L$ is the dynamic range of the pixel values, and $K_1 \ll 1$ and $K_2 \ll 1$ are two scalar constants. The general form of the Structural SIMilarity (SSIM) index between signal x and y is defined as:

(10)
where $\alpha, \beta, \; \text{and} \; \gamma$ are parameters to define the relative importance of the three components [18]. If $\alpha= \beta= \gamma =1$, the resulting SSIM index is given by:
(11)

SSIM is maximal when two images are coinciding (i.e., SSIM is <=1 ). The universal image quality index proposed in [17] corresponds to the case of $C_1 = C_2 = 0$ , therefore is a special case of Eq. (11).

A drawback of the basic SSIM index is its sensitivity to relative translations, scalings and rotations of images [18]. To handle such situations, a waveletdomain version of SSIM, called the complex wavelet SSIM (CW-SSIM) index was developed [25]. The CWSSIM index is also inspired by the fact that local phase contains more structural information than magnitude in natural images [26], while rigid translations of image structures leads to consistent phase shifts.

Despite its simplicity, the SSIM index performs remarkably well [18] across a wide variety of image and distortion types as has been shown in intensive human studies [27].

Instead of conclusion

As it was said in [18], ``we hope to inspire signal processing engineers to rethink whether the MSE is truly the criterion of choice in their own theories and applications, and whether it is time to look for alternatives.'' And I think that such articles provide a great deal of precious information for making decision to give away the MSE.


Useful links:
A very good and brief survey of images quality metrics, with links to MATLAB examples. Zhou Wang's page with huge amount of articles and MATLAB source code for UQI and SSIM. Another useful link for HDR images quality metrics.


Bibliography


1
Aleksandr Shnayderman, Alexander Gusev, and Ahmet M. Eskicioglu.
A multidimensional image quality measure using singular value decomposition.
In Image Quality and System Performance. Edited by Miyake, Yoichi; Rasmussen, D. Rene. Proceedings of the SPIE, Volume 5294, pp. 82-92, 2003.
2
A. M. Eskicioglu and P. S. Fisher.
A survey of image quality measures for gray scale image compression.
In Proceedings of 1993 Space and Earth Science Data Compression Workshop, pp. 49-61, Snowbird, UT, April 2, 1993.
3
Ligang Lu Zhou Wang, Alan C. Bovik.
Why is image quality assessment so difficult?
In In: Proceedings of the ICASSP'02, vol. 4, pp. IV-3313-IV-3316., 2002.
4
W. K. Pratt.
Digital Image Processing.
John Wiley and Sons, Inc., USA, 1978.
5
J.R. Fienup.
Invariant error metrics for image reconstruction.
Applied Optics, No 32, 36:8352-57, 1997.
6
J. L. Mannos and D. J. Sakrison.
The effects of a visual fidelity criterion on the encoding of images,.
IEEE Transactions on Information Theory, Vol. 20, No. 4:525-536, July 1974.
7
J. O. Limb.
Distortion criteria of the human viewer.
IEEE Transactions on Systems, Man, and Cybernetics, Vol. 9, No. 12:778-793, December 1979.
8
H. Marmolin.
Subjective mse measures.
IEEE Transactions on Systems, Man, and Cybernetics, Vol. 16, No. 3:486-489, May/June 1986.
9
J. A. Saghri, P. S. Cheatham, and A. Habibi.
Image quality measure based on a human visual system model.
Optical Engineering, Vol. 28, No. 7:813-818, July 1989.
10
B. N. Norman and H. B. Brian.
Objective image quality measure derived from digital image power spectra.
Optical Engineering, 31(4):813-825, 1992.
11
A.A. Webster, C. T. Jones, M. H. Pinson, S. D. Voran, and S. Wolf.
An objective video quality assessment system based on human perception.
In Proceedings of SPIE, Vol. 1913, 1993.
12
T. N. Pappas and R. J. Safranek.
in book ``Handbook of Image and Video Processing'' (A.Bovik, ed.), chapter Perceptual criteria for image quality evaluation.
Academic Press, May 2000.
13
B. Girod.
in book Digital Images and Human Vision (A. B. Watson, ed.), chapter What's wrong with mean-squared error, pages 207-220.
the MIT press, 1993.
14
S. Daly.
The visible difference predictor: An algorithm for the assessment of image fidelity.
In in Proceedings of SPIE, vol. 1616, pp. 2-15, 1992.
15
A. B. Watson, J. Hu, and J. F. III. McGowan.
Digital video quality metric based on human vision.
Journal of Electronic Imaging, vol. 10, no. 1:20-29, 2001.
16
J.-B. Martens and L. Meesters.
Image dissimilarity.
Signal Processing, vol. 70:155-176, Nov. 1998.
17
Z. Wang and A.C. Bovik.
A universal image quality index.
IEEE Signal Processing Letters, vol. 9, no. 3:81-84, Mar. 2002.
18
Z. Wang, A.C. Bovik, H.R. Sheikh, and E.P. Simoncelli.
Image quality assessment: From error visibility to structural similarity.
IEEE Transactions on Image Processing, vol. 13, no. 4:600-612, Apr. 2004.
19
Zhou Wang and Alan C. Bovik.
Mean squared error: Love it or leave it?
IEEE Signal Processing Magazine, 98:98-117, January 2009.
20
D.M. Chandler and S.S. Hemami.
Vsnr: A wavelet-based visual signal-to-noise ratio for natural images.
IEEE Transactions on Image Processing, vol. 16, no. 9:2284-2298, Sept. 2007.
21
Wiener N.
The extrapolation, interpolation and smoothing of stationary time series.
New York: Wiley, page 163р, 1949.
22
J.R. Fienup.
Refined wiener-helstrom image reconstruction.
Annual Meeting of the Optical Society of America, Long Beach, CA, October 18, 2001.
23
James R. Fienup, Douglas K. Griffith, L. Harrington, A. M. Kowalczyk, Jason J. Miller, and James A. Mooney.
Comparison of reconstruction algorithms for images from sparse-aperture systems.
In Proc. SPIE, Image Reconstruction from Incomplete Data II, volume 4792, pages 1-8, 2002.
24
D. Kahaner, C. Moler, and S. Nash.
Numerical Methods and Software.
Prentice-Hall, Inc., 1989.
25
Z. Wang and E.P. Simoncelli.
Translation insensitive image similarity in complex wavelet domain.
In Proceedings of IEEE International Conference of Acoustics, Speech, and Signal Processing, pp. 573-576., Mar. 2005.
26
T.S. Huang, J.W. Burdett, and A.G. Deczky.
The importance of phase in image processing filters.
IEEE Transactions on Acoustic, Speech, and Signal Processing, vol. 23, no. 6:529-542, Dec. 1975.
27
H.R. Sheikh, M.F. Sabir, and A.C. Bovik.
A statistical evaluation of recent full reference image quality assessment algorithms.
IEEE Transactions on Image Processing, vol. 15, no. 11:3449-3451, Nov. 2006.
Monday, March 16, 2009

Interesting facts about snakes' vision

The more I know about vision systems of animals, the more I think that it is advisable to read and study biology and biophysics for specialists in artificial imagery. So the main topic of this post are snakes that have an ability of thermal vision.

Not all of snakes have an ability of heat vision, but some groups of pythons and rattlesnakes can see both in visible and in far-IR band [1]. Snakes use infra-red radiation with wavelengths centred on 10 micrometers (wavelength corresponds to emitted from warmblooded animals). As it was written in [1],

certain groups of snakes do what no other animals or artificial devices can do. They form detailed images of extremely small heat signatures. What is most fascinating is that they do this with receptors that are microscopic in size, extraordinarily sensitive, uncooled, and are able to repair themselves. Snake infra-red imagers are at least 10 times more sensitive than the best artificial infra-red sensors...[1]

Several papers give us better understanding of how snakes can actually see and attack preys using only heat vision. A brief survey of articles devoted to snakes vision as well as some thoughts are given further.

How does the snake see?

The detection system, which consists of cavities located on each side of the head called pit organs, operates on a principle similar to that of a pinhole camera [2]. Pit vipers and boids, the two snake types that possess this ability, have heat-sensitive membranes that can detect the difference in temperature between a moving prey and its surroundings on the scale of mK. If the radiation intensity hitting the membrane at some point is larger than the emitted thermal radiation of the membrane itself, the membrane heats up at that location [2]. The picture of such cavities is presented in Fig. 1.

Figure 1: Snake's heat vision: a) head of a pit viper with nostril, pit hole, and eye, left to right. Photograph courtesy of Guido Westhoff; b) A pit viper's infra-red-sensitive pit organ works like a pinhole camera. The image from the paper [2].


According to the Planck radiation law as an approximation of the emitted heat intensity, 99% of the radiation is emitted at wavelengths under 75 micrometers and the radiation intensity is maximal at 9.5micrometers [3], which is within the 8-12 micrometers IR atmospheric transmittance window [4].

Because the pit hole is very large compared to the membrane size, the radiation strikes many points. Optical quality of the infra-red vision is much too blurry to allow snakes to strike prey with the observed accuracy of about 5 degrees. The most fascinating is an amount of heat-sensitive sensors and their precision:

In pit vipers, which have only two pit holes (one in front of each eye), a block of about 1600 sensory cells lie on a membrane which has a field of view of about 100 degrees . This means the snake's brain would receive an image resolution of about 2.5 degrees for point-like objects, such as eyes, which are one of the hottest points on mammals... [2]
If the aperture was very small, the amount of energy per unit time (second) reaching the membrane would also be small. The need to gather a reasonable amount of thermal energy per second necessitates the ``pinhole'' of the pit organ to be very large, thus greatly reducing its optical performance. If on the other hand the aperture of the organ is large, the image of a point source of heat is disc-shaped rather than point-like. Since, however, the size of the disc-shaped image may be determined by the detectors on the membrane, it is still possible to tell from which direction the radiation comes, ensuring directional sensitivity of the system [3]. The aperture size was probably an evolutionary trade-off between image sharpness and radiant flux [2]. Although the image that is formed on the pit membrane has a very low quality, the information that is needed to reconstruct the original temperature distribution in space is still available [3].

So how a snake could possibly use such poorly focused IR input to find its prey in darkness with a surprising angular precision of 5 degrees? How the snake may be able to extract information on the location of the prey from the blurred image that is formed on the pit-membrane?


What does the snake see?

Without the ability of real-time imaging the IR organ would be of little use for the snake. So Dr. van Hemmen proved that it is possible to reconstruct the original heat distribution using the blurred image on the membrane [3].

The image on the membrane resulting from the total heat distribution in space will be some complicated shape that consists of the superposition of the contributions of all heat sources [3]. A superposition of edge detectors in the brain can now reconstruct the heat distribution by using the whole image on the membrane for each point in space to be reconstructed. So reconstruction is possible because the information is still available in the blurred image on the pit membrane, where the receptors are [2]. As a demonstration of the model, sample image (see Fig. 2) was used.


Figure 2: The famous hare by Durer (left) was converted into 8- bit gray levels at a resolution of 32x32 (right). The image from the paper [2].

Since a snake has limited computational resources (all ``calculations'' must be realizable in neuronal ``hardware'') the reconstruction model must be simple. Our model [5] thus uses only one computational step (it is noniterative) to estimate the input image from the measured response on the pit membrane. It resembles a Wiener filter and is akin to, but different from, some of the algorithms used in image reconstruction [6].

So it is highly remarkable that snakes can perform some kind of an image processing, like our artificial devices based on ``wavefront coding''[7,8] and ``pupil engineering''[9,10] techniques.


Image processing in nature

There was developed a neuronal algorithm [11] that accurately reconstructed the heat image from the membrane. The most vital requirements is accurate detectors and the ability to detect edges in the images produced on the pit membrane [2]. That is similar to the situation with ``wavefront coding'' devices: the dynamic range and accuracy of the ADC is much more important than it is much more important than an amount of elements.

I would like to introduce an analogy here: such imaging is like drawing a picture on a sand. The more fine the sand, the more accurate and delicate pictures one can draw. That is the case of high dynamic range of the detector. And vice versa: on a coarse and stony sand it is difficult to draw a fine tracery that is the case of low dynamic range's detector [12,13].

But let us get back to the model of snakes vision:

The model has a fairly high noise tolerance. For input noise levels up to 50%, the hare is recognizable. Sensitivity to measurement errors is larger. In our calculations, one pixel of the reconstructed image corresponds to about 3 degrees . For detector noise levels up to about 1% of the membrane heat intensity, a good reconstruction is possible, meaning that the edge of the hare may be determined with about one pixel accuracy. At detector noise levels beyond about 1%, the image is not so easily recognizable, but the presence of an object is still evident...[5]

The assumptions that went into the calculations are a ``worst case scenario''. For instance, we assumed [3] that the input to the pit organ is totally uncorrelated, meaning that the snake has no idea what heat distribution to expect. In reality, important information about the environment is always available. For example, typical temperature and size of a prey animal may be encoded in the neuronal processing structure. If the snake ``knows'' what kind of images to expect, the reconstruction process can be enhanced considerably [3].

How does the reconstruction matrix become imprinted on the snake's neural circuitry in the first place? ``It can't be genetic coding,'' says van Hemmen. ``The snake would need a suitcase full of genes to encode such detail. Besides we know that snakes ...need a season of actual learning, not just anatomical maturation, to acquire their extraordinary skills.''... [11]

On the Fig. 3 it is shown a deconvolution results that give us a concept of the snakes vision capabilities.


Figure 3: On the left, this figure displays the membrane heat intensity as captured by the ``pithole camera''. On the right are reconstructions for four different membrane noise levels. The pit membrane was taken as a flat square containing 41x41 receptors. The model works equally well if applied to other membrane shapes. The membrane noise term was taken to be Gaussian with SIGMA= 25, 100, 200, and 500 from left to right and top to bottom, corresponding to 0.25%, 1%, 2%, and 5% of the maximal membrane intensity. The image from the paper [2]

Ultimately, a snake's ability to utilize information from the pit organs depends on its capability to detect edges in the image produced on the pit membrane. If the snake performed no reconstruction, but instead simply targeted bloblike ``hot spots'' on the membrane, it would still have to be able to discern the edge of the blob. The present model performs edge detection for all spatial positions and hence automatically creates a full reconstruction. A level of neuronal processing beyond what is represented in our model is unlikely to be beneficial since the quality of the system is fundamentally limited by the relatively small number of heat receptors.[5]

Conclusion

Snakes' heat vision presents such a clear image when reconstructed that it surpasses even many human devices - it is far better than any technical uncooled infra-red camera with a similar number of detector cells [2].

Bibliography


1
Liz Tottenham.
Infrared imaging research targets 'snake vision'.
web publication - Discovery: Florida Tech, DE-402-901:4-5, 2002.
2
Lisa Zyga.
Snakes' heat vision enables accurate attacks on prey.
PhysOrg.com, www.physorg.com/news76249412.html, page 2, 2006.
3
Andreas B. Sichert, Paul Friedel, and J. Leo van Hemmen.
Modelling imaging performance of snake infrared sense.
In Proceedings of the 13th Congress of the Societas Europaea Herpetologica. pp. 219-223; M. Vences, J. Kohler, T. Ziegler, W. Bohme (eds): Herpetologia Bonnensis II., 2006.
4
David A. Allen.
Infrared: The New Astronomy.
Infrared: The New Astronomy, 1975.
5
Andreas B. Sichert, Paul Friedel, and J. Leo van Hemmen.
Snake's perspective on heat: Reconstruction of input using an imperfect detection system.
PHYSICAL REVIEW LETTERS, PRL 97:068105, 2006.
6
R. C. Puetter, T. R. Gosnell, and Amos Yahil.
Annu. Rev. Astron. Astrophys, 43:139, 2005.
7
J. van der Gracht, E.R. Dowski, M. Taylor, and D. Deaver.
New paradigm for imaging systems.
Optics Letters, Vol. 21, No 13:919-921, July 1, 1996.
8
Jr. Edward R. Dowski and Gregory E. Johnson.
Wavefront coding: a modern method of achieving high-performance and/or low-cost imaging systems.
In Proc. SPIE, Current Developments in Optical Design and Optical Engineering VIII, volume 3779, pages 137-145, 1999.
9
R. J. Plemmons, M. Horvath, E. Leonhardt, V. P. Pauca, S. Prasad, S. B. Robinson, H. Setty, T. C. Torgersen, J. van der Gracht, E. Dowski, R. Narayanswamy, and P. E. X. Silveira.
Computational imaging systems for iris recognition.
In Proc. SPIE, Advanced Signal Processing Algorithms, Architectures, and Implementations XIV, volume 5559, pages 346-357, 2004.
10
Sudhakar Prasad, Todd C. Torgersen, Victor P. Pauca, Robert J. Plemmons, and Joseph van der Gracht.
Engineering the pupil phase to improve image quality.
In Proc. SPIE, Visual Information Processing XII, volume 5108, pages 1-12, 2003.
11
Bertram Schwarzschild.
Neural-network model may explain the surprisingly good infrared vision of snakes.
Physics Today, IX:18-20, September 2006 Physics Today.
12
Konnik M.V.
Image's linearization from commercial cameras used in optical-digital systems with optical coding.
In Proceedings of 5th International Conference of young scientists ``Optics-2007'', Saint-Petersburg, pages 354-355, 2007.
13
M.V. Konnik, E.A. Manykin, and S.N. Starikov.
Increasing linear dynamic range of commercial digital photocamera used in imaging systems with optical coding.
In OSAV'2008 Topical meeting, Saint-Petersburg, Russia, 2008.


Related Posts Plugin for WordPress, Blogger...