Thursday, October 18, 2012

Optimization and other Advanced Mathematics in LaTeX

Sometimes we need to put optimization problems in the paper, and the typesetting of the optimization in LaTeX is a bit tricky.


Optimization problems in LaTeX
In optimization we want to minimize or maximize an objective function over a set of decision variables sbject to constraints. There are different ways to format optimization problems, but the preferable way is to follow an excellent book “Convex Optimization” by Stephen Boyd and Lieven Vandenberghe. A general optimization problem has the form:


The LaTeX code for this formulae is the following:

\begin{equation*}
\begin{aligned}
& \underset{x}{\text{minimize}}
& & f_0(x) \\
& \text{subject to}
& & f_i(x) \leq b_i, \; i = 1, \ldots, m.
\end{aligned}
\end{equation*}

If we want to perform quadratic programming, the notation will be the following:

The LaTeX code for it is:
   
\begin{equation*}
\begin{aligned}
& \underset{x}{\text{minimize}}
& & J(x) = \frac{1}{2} \mathbf{x}^T Q \mathbf{x} + c^T \mathbf{x} \\
& \text{subject to}
& & A\mathbf{x} \leq \mathbf b \mbox{ (inequality constraint)} \\
&
& & E\mathbf{x} = \mathbf d \mbox{ (equality constraint)}
\end{aligned}
\end{equation*}
  
Unlike the tabular environment, in which you can specify the alignment of each column, in the aligned environment, each column (separated by &) has a default alignment, which alternates between right and left-aligned. Therefore, all the odd columns are right-aligned and all the even columns are left-aligned.


Another example of the optimization problem:


and the LaTeX code:

\begin{equation*}
\begin{aligned}
& \underset{X}{\text{minimize}}
& & \mathrm{trace}(X) \\
& \text{subject to}
& & X_{ij} = M_{ij}, \; (i,j) \in \Omega, \\
&&& X \succeq 0.
\end{aligned}
\end{equation*}

Here  $X \succeq 0$ means that the matrix $X$ is positive semidefinite.

This LaTeX recepe was found here.


How to render argmax / argmin operator in LaTeX?
One can use the following expression in LaTeX:
 
\begin{equation}
\arg\max_{x}
\end{equation}

which will produce the folowing:


However, you might prefer a different way that centers x in arg max expression using \underset command:

\begin{equation}
\underset{x}{\arg\max}
\end{equation}

and the result will be:

In order to use the command, you need to add the amsmath package in the preambule:

\usepackage{amssymb,amsmath,amsfonts,latexsym,mathtext}

This idea was found here.


How to add single-sided brackets in latex?

This is some kind of dirty LaTeX hack but it works nicely:

\begin{equation}
P_\Omega(x) = \left\{\begin{array}{lll}
l_i & if & x_i<l_i\\
x_i & if & x_i\in[l_i,u_i]\\
u_i & if & x_i>u_i
\end{array}\right.
\end{equation}

and it generates what we want:

Look closely for the right. statement - the dot at the end is important! Note that to produce the single-sided brackets, you need to add empty \left. or \right.  brackets.


The trick has been taken from here: how to add single-sided brackets in latex


Sunday, September 2, 2012

Normalised histogram calculation


Normalised histogram calculations

The usual approximation for the probability density function is a histogram. The probability density function is non-negative everywhere, and its integral over the entire space is equal to one [1]. Formally, a random variable X has density f, where f is a non-negative Lebesgue-integrable function, if:

\operatornameP[a ≤ X ≤ b]=∫abf(x)\,\mathrm{d}x.


There are many ways to normalise the histogram, and some of those methods have limitations. Consider all of them.


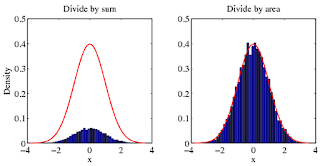
Normalisation by sum

This solution answers the question How to have the sum of all bins equal to 1. The example of code is here:


[f,x]=hist(randn(10000,1),50);%# create histogram from a normal distribution.
g=1/sqrt(2*pi)*exp(-0.5*x.^2);%# pdf of the normal distribution

%#METHOD 1: DIVIDE BY SUM
figure(1)
bar(x,f/sum(f));hold on
plot(x,g,'r');hold off


This approximation is valid only if your bin size is small relative to the variance of your data [2]. The sum used here correspond to a simple quadrature formula, more complex ones can be used like trapz.


Normalisation by area

For a probability density function, the integral over the entire space is 1. The previous accepted answer will not give you the correct density. To get the right density, you must divide by the area. To illustrate my point, try the following example.


[f,x]=hist(randn(10000,1),50);%# create histogram from a normal distribution.
g=1/sqrt(2*pi)*exp(-0.5*x.^2);%# pdf of the normal distribution

%#METHOD 1: DIVIDE BY SUM
figure(1)
bar(x,f/sum(f));hold on
plot(x,g,'r');hold off

%#METHOD 2: DIVIDE BY AREA
figure(2)
bar(x,f/trapz(x,f));hold on
plot(x,g,'r');hold off

You can see for yourself which method agrees with the correct answer (red curve).


However, for some distributions (like Cauchy) I have found that trapz will overestimate the area, and so the pdf will change depending on the number of bins you select. In this case it is useful to do:
[N,h]=hist(q_f./theta,30000);
% there Is a large range but most of the bins will be empty
plot(h,N/(sum(N)*mean(diff(h))),'+r')

Appendix: Trapezoid integration

Trapezoidal numerical integration in MATLAB is done by the function called trapz.

Syntax

Z = trapz(Y) computes an approximation of the integral of Y via the trapezoidal method (with unit spacing). To compute the integral for spacing other than one, multiply Z by the spacing increment. Input Y can be complex. If Y is a vector, trapz(Y) is the integral of Y. If Y is a matrix, trapz(Y) is a row vector with the integral over each column.

Z = trapz(X,Y) computes the integral of Y with respect to X using trapezoidal integration. Inputs X and Y can be complex.


Example of trapz application

Let's compute the 0πsin(x)dx. The exact value of this integral is 2.

To approximate this numerically on a uniformly spaced grid, use

X = 0:pi/100:pi;

Y = sin(X);

Then use the trapz function:

Z = trapz(X,Y)

that produces:

Z = 1.9998

The result is not as accurate as the uniformly spaced grid [3].


Monday, August 6, 2012

NP Hard problem - explanation from Stephen Boyd

Students used to ask me about this - what is NP-hard problem and why is it important? The exact answer can easily be a topic of a monograph, but I have been looking for a simple yet accurate answer.


Well, NP stands for Non-deterministic Polynomial time. Simply speaking, an NP-complete problem cannot be solved in polynomial time in any known way. NP-Hard/NP-Complete is a way of showing that certain classes of problems are not solvable in realistic time.


Basically, a solution has to be testable in polynomial time. If that's the case, and a known NP problem can be solved using the given problem with modified input (an NP problem can be reduced to the given problem) then the problem is NP complete. NP-complete means the problem is at least as hard as any problem in NP.


On the other hand, there are polynomial-time problems. The class P consists of those problems that are solvable in polynomial time. For example, they could be solved in O(n^k) for some constant k, where n is the size of the input. Simply put, you can write a program that will run in reasonable time.

A decision problem is in P if there is a known polynomial-time algorithm to get that answer. A decision problem is in NP if there is a known polynomial-time algorithm for a non-deterministic machine to get the answer.

There is a good lecture notes about the NP-hard problems [PDF].

A simple and understandable explanation of the NP-hard problem that I like is given by Stephen Boyd:


This explanation is a bit watery, but basically boils down to the following. People identified a bunch of (computationally) very hard problems, to which nobody figured out a polynomial-time algorithm.

When the problem comes in, you measure the size of the data required to describe the problem. Then you look on the number of operations you have to do, and if you can bound that number of computations by polynomial, that's the polynomial-type problem.

There is a catalog of problems that are considered as computationally hard. You can call the problem as NP-hard if it is as hard as any of the problems from that catalog (e.g., travelling salesman).

Wednesday, October 12, 2011

Compressed sensing: notes and remarks

This short note is about the tutorial [1] on compressed sensing (CS) recently published in Optical Engineering journal. The tutorial introduces a mathematical framework that provide insight into how a high resolution image can be inferred from a relatively small number of measurements. Among other applications, such as IR imaging and compressing video sequences, astronomical applications [2] of CS are very attractive.


The idea of Compressed Sensing
The basic idea of CS [1] is that when the image of interest is very sparse or highly compressible in some basis, relatively few well-chosen observations suffice to reconstruct the most significant nonzero components. It can be also considered as projecting onto incoherent measurement ensembles [2]. Such an approach should be directly applied in the design of the detector. Devising an optical system that directly “measures” incoherent projections of the input image would provide a compression system that encodes in the analog domain.

Rather than measuring each pixel and then computing a compressed representation, CS suggests that we can measure a “compressed” representation directly.

The paper [1] provides a very illustrative example of searching the bright dot on a black background: instead of full comparison (N possible locations), the CS allows to do it in M=log2(N) binary measurements using binary masks.

The picture from the paper [1]


The key insight of CS is that, with slightly more than K well-chosen measurements, we can determine which coefficients of some basis are significant and accurately estimate their values.

A hardware example of Compressed sensing
An example of a CS imager is the rice single-pixel camera developed by Duarte et al [3,4]. This architecture uses only a single detector element to image a scene. A digital micromirror array is used to represent a pseudorandom binary array, and the scene of interest is then projected onto that array before the aggregate intensity of the projection is measured with a single detector.


Using Compressed Sensing in Astronomy
Astronomical images in many ways represent a good example of highly compressible data. An example provided in [2] is Joint Recovery of Multiple Observations. In [2], they considered a case that the data are made of N=100 images such that each image is a noise-less observation of the same sky area. The goal is to propose the decompression the set of observations in a joint recovery scheme. As the paper [2] shows, CS provides better visual and quantitative results: the recover SNR for CS is 46.8 dB, while for the JPEG2000 it is only 9.77 dB.

Remarks on using the Compressed Sensing in Adaptive optics
The possible application of the CS in AO can be for centroiding estimation. Indeed, the centroid image occupies only a small portion of the sensor. The multiple observations of the same centroid can lead to increased resolution in centroiding and, therefore, better overall performance of the AO system.

References:
[1] Rebecca M. Willett, Roummel F. Marcia, Jonathan M. Nichols, Compressed sensing for practical optical imaging systems: a tutorial. Optical Engineering 50(7), 072601 (July 2011).

[2] Jérôme Bobin, Jean-Luc Starck, and Roland Ottensamer, Compressed Sensing in Astronomy, IEEE JOURNAL OF SELECTED TOPICS IN SIGNAL PROCESSING, VOL. 2, NO. 5, OCTOBER 2008.

[3] M. F. Duarte, M. A. Davenport, D. Takhar, J. N. Laska, T. Sun, K. Kelly, and R. G. Baraniuk, “Single-pixel imaging via compressive sampling,” IEEE Signal Process. Mag. 25(2), 83–91 (2008).

[4] W. L. Chan, K. Charan, D. Takhar, K. F. Kelly, R. G. Baraniuk, and D. M. Mittleman, “A single-pixel terahertz imaging system based on compressed sensing,” Appl. Phys. Lett. 93, 121105 (2008).

Sunday, September 25, 2011

SPIE Optical Engineering and Applications 2011 - presentations from Astromentry section

Some interesting papers from the Astrometry section that held on Wednesday. This is not about the Adaptive optics, but still contains some interesting points.


1. Differention Tip-Tilt Jitter.

It is well known fact that the Tip/Tilt is the main source of distrubance in atmospherical seeing. Other distortions to consider are geometrical ones, like cushion/barrel.

Atmosphere is like a prism - it can displace the star position. Advantages of large telescopes are therefore reduced by CDAR noise.


Dynamic distortion calibration using a diffracting pupil: high-precision astrometry laboratory demonstration for exoplanet detection, . . . . . . [8151-29]


They want to create diffraction spikes. 


Saturday, September 17, 2011

Interesting astronomical papers from SPIE Optical Engineering and Applications conference 2011

More about papers from the SPIE conference; main section about the adatpvie optics was on Sunday, but some other interesting posters were in other days as well. 


Advancements in laser tomography implementation at the 6.5m MMT,  . . . .[8149-07]


The system on the MMT uses 5 LGS stars, 336 voice-coil actuators and they trying to use dynamics focus. The LGS they use is sodium beacon, and, as it is well known fact, the sodium LGS tends to elongate.


They capture everything on one CCD - this means that all of LGS on one CCD. They also use the WFS instrument for the NGS light from tip-tilt star (to sense the tip/tilt distortion).


Least-squares LTAO implementation uses SVD decompostition (modal decomposition) for tomographical reconstruction. Wind can be detected from multiple LGS beacons. They obtain then a tomographic matrix.


However, the problem with the SVD is computationally intensive algorithms.

The further challenges are presented on the slide above.


Wavefront control with SCExAO: concepts and first on-sky results,
Olivier Guyon, Frantz Martinache, Christophe Clergeon, Robert Russell, Subaru Telescope, National Astronomical Observatory of Japan (United States); . . . . . . . . . . . .[8149-08]


The paper presents a wavefront control on the Subaru telescope. They use phase induced amplitude apodizer (PIAA) - a novel concept that can be used for the coronography.

The PIAA is used for the redistribution of light without loss. They try to decrease the speackles using the PIAA.


A sensitivity comparison between the non-linear curvature wavefront
sensor and the Shack-Hartmann wavefront sensor in broadband, Mala Mateen,  . . . . . . . . . . . . . . . . . . . . . . . . . . . . . . . .[8149-09]

This was a really strange presentation. The promising title was ruined by poor presentation: out of slides it was impossible to understand the point.

They tried to compare Curvature WFS that measures:

\[ C = \frac{W_+ - W_-}{W_+ + W_-}

They observed Talbot effect:
Talbot imaging is a well-known effect that causes sinusoidal patterns to be reimaged by diffraction with characteristic period that varies inversely with both wavelength and the square of the spatial frequency. This effect is treated using the Fresnel diffraction integral for fields with sinusoidal ripples in amplitude or phase. The periodic nature is demonstrated and explained, and a sinusoidal approximation is made for the case where the phase or amplitude ripples are small, which allows direct determination of the field for arbitrary propagation distance.
[from the paper: Analysis of wavefront propagation using the Talbot effect
Ping Zhou and James H. Burge, Applied Optics, Vol. 49, Issue 28, pp. 5351-5359 (2010)       doi:10.1364/AO.49.005351 » View Full Text: Acrobat PDF (785 KB) ]


Image plane phase-shifting wavefront sensor for giant telescope
active and adaptive optics, François Hénault, Univ. de Nice Sophia Antipolis (France) . . . . . . . . . . . . . . . . . . . . . . . . . . . .[8149-10]

The paper is about phase shifting WFS, although the speaker was not very detailed in descriptions.


The thing is, they use it for making a cross-spectram measurements.


Friday, September 9, 2011

Finding a problem for the Research

In the July issue of IEEE Spectrum journal, there were a short but interesting article entitled "In Research, the Problem is the Problem". The author of it reflects about some issues of problem finding - that is, how to find a really worthy research question. There are no definite solution, of cource, but the article itself (one page only) is worth to read and think about. Here are some quotes from it (OCRed version is here).


A problem well stated is a problem half solved. -- Inventor Charles Franklin Kettering (1876-1958)


The solution of problem is not difficult; but finding a problem -- there's the rub. Engineering education is based on the presumption that there exists a predefined problem worthy of a solution.


Internet pioneer Craig Partridge recently sent around a list of open research problems in communications and networking, as well as a set of criteria for what constitutes a good problem. He offers some sensible guidelines for choosing research problems:

  • having a reasonable expectation of results
  • believing that someone will care about your results
  • others will be able to build upon them
  • ensuring that the problem is indeed open and under-explored.
All of this is easier said than done, however. Given any prospective problem, a search may reveal a plethora of previous work, but much of it will be hard to retrieve. On the other hand, if there is little or no previous work, maybe there's a reason no one is interested in this problem.


Real progress usually comes from a succession of incremental and progressive results, as opposed to those that feature only variations on a problem's theme.


At Bell Labs, the mathematician Richard Hamming used to divide his fellow researchers into two groups: those who worked behind closed doors and those whose doors were always open. The closed-door people were more focused and worked harder to produce good immediate results, but they failed in the long term.


Today I think we can take the open or closed door as a metaphor for researchers who are actively connected and those who are not. And just as there may be a right amount of networking, there may also be a right amount of reading, as opposed to writing. Hamming observed that some people spent all their time in the library but never produced any original results, while others wrote furiously but were relatively ignorant of the relevant literature.

Related Posts Plugin for WordPress, Blogger...