Tuesday, August 30, 2011

Highlights of the SPIE Optical Engineering + Applications Conference at San Diego, CA, 2011


Most of interesting oral presentations was on Sunday, where the astronomical adaptive optics was discussed. Here are some remarks on them from the section Astronomical Adaptive Optics Systems and Applications V.


Integration and test of the Gemini Planet Imager . . . . . . .[8149-01]
For the extreme AO, they plan to achieve 2-4 arcseconds of angular resolution. Since it is a Cassegrain focus, the instruments must be located under the focus and move with the telescope.
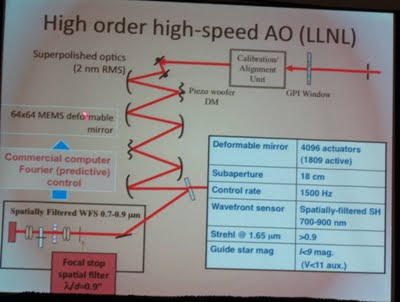
There are some interesting lessons they learned from the WFS:
  • small subapertures make it hard to align;
  • mount of the camera is hard to align;
The lenslet size is 63 micrometers that introduces a lot of diffraction effects.

The controller they use is commercial closed black-box (Fourier, predictive controller).
The WFS used is Shack-Hartmann quadcell. WFS noise is 4-5 e- at 1 KHz speed.


The TMTracer: a modeling tool for the TMT alignment and phasing
system, Piotr K. Piatrou, Gary A. Chanan, Univ. of California, Irvine (United States) . . . .[8149-03]

This is about the simulator of the TMT parts written by Piotr K. Piatrou on FORTRAN 95. No diffraction effects, only ray tracing.

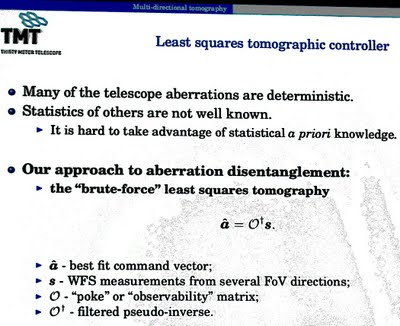
This is for alignment and phase sensing of the telescope mirrors. The control of the wavefront is LS tomography - filtration of commands directly to DM. This is due to huge amount of data.
Observability must be computed theoretically, then the SVD decomposition is used.


Athermal design of the optical tube assemblies for the ESO VLT Four Laser Guide Star Facility, Rens Henselmans, David Nijkerk, Martin Lemmen, Fred Kamphues, TNO Science and Industry (Netherlands) . . . .[8149-04]

Interesting speech about the design of LGS tube, they actually use it for VLT with 4 GS for lambda=589 nm and power 25 W.
Optical design of the LGS tube is classical Gallilean 20x beamer expander. Athermal design was a primary goal. Laser absorption is estimated as 0.1 ... 1% for 25 W which is pretty much. They are making a big tube from invar (steel alloy) to expand a light beam - not from caron since it is very expensive. L2 Lense in their design is 38 cm in diameter.


Overview of the control strategies for the TMT alignment and phasing system, Piotr K. Piatrou, Gary A. Chanan, Univ. of California, Irvine (United States) . . . . . . . . .[8149-05]

The main goal here is to automatically control alignment of AO parts on the TMT. The multidirectional tomography is the mainstream approach for TMT alignment.The PAS (alignment and phasing system) is n open-loop system without accounting for the dynamics.
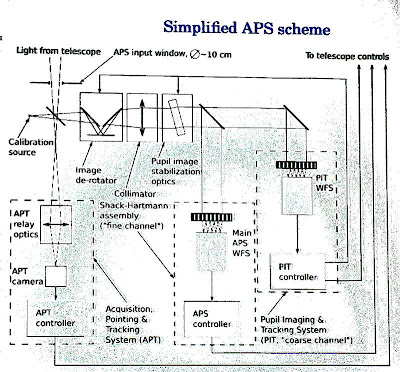
This is for the alignment only. The control is brute-force LS tomography because of huge amount of data. They have 33GB for SVD, and therefore use complexity reduction methods. For instance, projection mehtod like Oa = s -> \[ P\dagger O a = P\dagger a \]

In the case of TMT, I think, it is possbile to nglect the dynamics of the system completely and just assume that the system is static. For low and medium frequencies it will probbly work well. That cruel algorithm (just throw the command to DM) explains the 2*opd coefficient 2.
The quasi-continuous part for the control.



Sunday, August 28, 2011

Manufacturing and using the continuous-facesheet deformable mirrors

There are some notes from SPIE Optical Engineering + Applications poster discussions and presentations about deformable mirrors.


It was interesting to know that Xinetics still uses very strong actuators that can actually break the mirror even in the presence of electrical protection. Some say they just do not want to upgrade their technology as NASA buys from them. Therefore, if there are very powerful actuators, the beackage of a mirror is possible. Other, like Gleb Vdovin from OKO Technologies, use soft actuators (piezoelectric ones) and the force of them is not enough to break the mirror.


How to attach an actuator to a Deformable Mirror?

Simple answer: using epoxy glue. Surprisingly, even after many days of work epoxy glue still holds actuators very well. Moreover, there were special tests: for instance, one can write a program (DMKILL) that throws random "0" and "+max" voltages on the mirror. It was reported that the first actuator broken down after at least 10 days (!) of constant work in such a regimen.


In the case of broken actuator, many people suggested just to throw it away as a loss of one actuator does not effects the rest too badly.


Main problem is Tip\Tilt

Tip and Tilt are the major sources of problems caused by the atmospheric turbulence. An impact of the higher aberrations falls very quickly. The correction is therefore required for the tip/tilt.

For this, a WFS with Zernike fitting can be helpful.


However, as Guan Ming Dai notes in his paper "Comparison of wavefront reconstructions with Zernike polynomials and Fourier transforms." [J Refract Surg. 2006 Nov;22(9):943-8.],
Fourier full reconstruction was more accurate than Zernike reconstruction from the 6th to the 10th orders for low-to-moderate noise levels. Fourier reconstruction was found to be approximately 100 times faster than Zernike reconstruction. Fourier reconstruction always makes optimal use of information. For Zernike reconstruction, however, the optimal number of orders must be chosen manually.


Wednesday, August 24, 2011

Interesting posters from SPIE Optical Engineering + Applications San Diego, CA, 2011

  1. Na variability and LGS elongation: impact on wavefront error, Katharine J. Jones, WBAO Consultant Group (United States). . . . . . . . . . . . . . . . . . . .[8149-14]
  2. MT_RAYOR: a versatile raytracing tool for x-ray telescopes, Niels Jørgen S.

    Westergaard, Technical Univ. of Denmark (Denmark) . . . . . . . . . . . . . [8147-64] <---- this simulator is actually written on Yorick
  3. A hardware implementation of nonlinear correlation filters, Saul Martinez-

    Diaz, Hugo Castañeda Giron, Instituto Tecnológico de La Paz (Mexico)[8135-49] <--- the poster actually is about morphological filtres implemented in hardware.
  4. Development of the visual encryption device using higher-order

    birefringence, Hiroyuki Kowa, Takanori Murana, Kentaro Iwami, Norihiro

    Umeda, Tokyo Univ. of Agriculture and Technology (Japan); Mitsuo Tsukiji,

    Uniopt Co. Ltd. (Japan); Atsuo Takayanagi, Tokyo Univ. of Agriculture and

    Technology (Japan) . . . . . . . . . . . . . . . . . . . . . . . . . . . . . . . . . . . . . . . . [8134-32]
  5. Enhancement of the accuracy of the astronomical measurements carried

    on the wide-field astronomical image data, Martin Rerábek, Petr Páta, Czech

    Technical Univ. in Prague (Czech Republic) . . . . . . . . . . . . . . . . . . . . . [8135-58]
  6. Astronomical telescope with holographic primary objective, Thomas D.

    Ditto, 3DeWitt LLC (United States) . . . . . . . . . . . . . . . . . . . . . . . . . . . . [8146-40]
  7. Calibration of the AVHRR near-infrared (0.86 μm) channel at the Dome

    C site, Sirish Uprety, Changyong Cao, National Oceanic and Atmospheric

    Administration (United States). . . . . . . . . . . . . . . . . . . . . . . . . . . . . . . . [8153-74]


Wednesday, August 17, 2011

A note about Greenwood frequency

Greenwood frequency\cite{greenwoodbandwidth} is a single parameter that can represent the entire spectrum for adaptive optics. It is a measure of the characteristic frequency of the tilt of atmospheric turbulence\cite{tysonprinciplesbook}, and is expressed by Tyler\cite{tyler1994bandwidth} for the G-tilt:


where $v_w(z)$ is a wind velocity, and $\beta$ is the zenith angle. The Greenwood frequency can be associated with turbulence temporal error. The atmospheric turbulence conjugation process can be limited by temporal deficiencies as well as spatial ones\cite{karr1991temporal}. Assuming perfect spatial correction, Greenwood\cite{greenwoodbandwidth} showed that the variance of the corrected wavefront due to temporal limits is given by: $$\sigma^2_{temp} = \int_{0}^{\infty} |1 - H(f,f_c)|^2 P(f) df$$ where the $P(f)$ is the disturbance power spectrum\cite{tysonprinciplesbook}. The higher-order wavefront variance due to temporal constraints is $$\sigma_{temp}^2 = [\frac{f_G}{f_{3~dB}}]^{5/3}$$ where the $f_G$ is the Greenwood frequency.


Greenwood frequency as an estimation of a controller's bandwidth

The required frequency bandwidth of the control system is called the Greenwood frequency\cite{greenwoodbandwidth}. An adaptive optics system with a closed-loop servo response should reject most of the phase fluctuations. Greenwood\cite{greenwoodbandwidth} calculated the characteristic frequency $f_G$ as follows:


where $\beta$ is the zenith angle, $v_w$ is wind velocity. In the case of a constant wind and a single turbulent layer, the Greenwood frequency $f_G$ can be approximated by: $$f_G = 0.426 \frac{v_w}{r_0},$$ where $v_w$ as the velocity of the wind in meters/sec and $r_0$ is the Fried parameter. Greenwood\cite{greenwoodbandwidth} determined the required bandwidth, $f_G$ (the Greenwood frequency), for full correction by assuming a system in which the remaining aberrations were due to finite bandwidth of the control system\cite{saha2010aperture}. Greenwood derived the mean square residual wavefront error as a function of servo-loop bandwidth \textit{for a first order controller}, which is given by:


where $f_c$ is the frequency at which the variance of the residual wavefront error is half the variance of the input wavefront, known as 3 db closed-loop bandwidth of the wavefront compensator, and $f_G$ the required bandwidth\cite{saha2010aperture}. It must be noted that the required \textit{bandwidth for adaptive optics does not depend on height}, but instead is proportional to $v_w /r_0$ , which is in turn proportional to $\lambda^{-6/5}$. If the turbulent layer moves at a speed of 10 m/s, the closed loop bandwidth for $r_0 \approx 11$ cm, in the optical band (550 nm) is around 39 Hz\cite{saha2010aperture}.


For most cases of interest, the Greenwood frequency of the atmosphere is in the range of tens to hundreds of Hertz. Beland and Krause-Polstorff\cite{greenwoodfreqvariation} present measurements that show how the Greenwood frequency can vary between sites. Mt. Haleakala in Maui, Hawaii, has an average Greenwood frequency of 20 Hz. For strong winds and ultraviolet wavelengths, the Greenwood frequency can reach 600 Hz. The system bandwidth on bright guide stars is, in most cases, several times larger than the Greenwood frequency.


\begin{thebibliography}{1}

\bibitem{greenwoodbandwidth} D.~P. Greenwood.

\newblock
Bandwidth specification for adaptive optics systems.

\newblock
{\em J. Opt. Soc. Am.}, 67:390--93, 1977.


\bibitem
{tysonprinciplesbook} R.~Tyson.

\newblock
Principles of adaptive optics. \newblock 2010.


\bibitem{tyler1994bandwidth} G.A. Tyler.

\newblock
Bandwidth considerations for tracking through turbulence.

\newblock {\em JOSA A}, 11(1):358--367, 1994.


\bibitem
{karr1991temporal} T.J. Karr.

\newblock Temporal response of atmospheric turbulence compensation.

\newblock
{\em Applied optics}, 30(4):363--364, 1991.


\bibitem{saha2010aperture} S.K. Saha.

\newblock Aperture synthesis: Methods and applications to optical astronomy.

\newblock
2010.


\bibitem{greenwoodfreqvariation} R.~Beland and J.~Krause-Polstorff.

\newblock Variation of greenwood frequency measurements under different meteorological conditions.

\newblock
In {\em Proc. Laser Guide Star Adaptive Optics Workshop 1, 289. Albuquerque, NM: U. S. Air Force Phillips Laboratory}, 1992.

\end{thebibliography}

Monday, August 15, 2011

A laser from a living cell

In the OPN journal there was published a short note about the laser from a living cell. The cell was genetically engineered to produce a green-glowing jellyfish protein. Then the cell was placed between two reflectors.


From To Imaging, and Beyond!


In such a setup the cell acts as the laser's gain medium. When pumped with a brief burst of blue light, the proteins fluoresced, generating light that bounced back and forth between the reflectors, gaming more energy with each pass through the cell.


By the way, from the OPN journal again, the table of lasers and their power:


Quite nice.

Wednesday, August 3, 2011

Simulink tricks: multiple plots / two or more inputs on Scope

In the Simulink's scope block, which is commonly used to display the results of the simulation, has only one input port. But sometimes we want to display more than one signal on the same axis. There are several tricks to display multiple plots (two or more inputs) on the Scope.


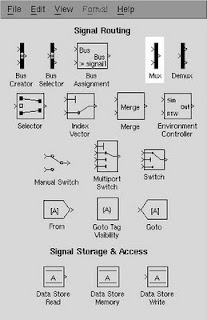
Trick 1: use Mux block

Use the Mux block from the Signal Routing palette:

to merge two signals in one and connect them to Scope. Here is an example scheme:


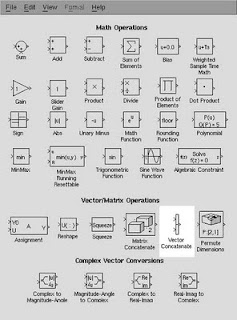
Trick 2: use Vector concatenate block

Another solution is to use the Vector Concatenate block from the Signal Routing palette:

This trick will collect all the signals to be displayed, and then to connect the output from the vector concatenate block to the one input port of the Scope. In matrix case, of course, use Matrix concatenate. The example of schematics is presented below:


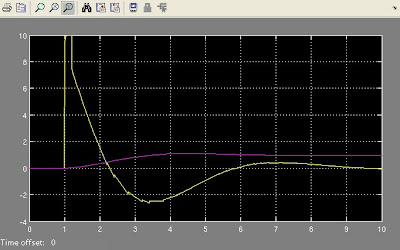
The result
Simulink will automatically highlight each signal by a different colour, as shown below:
Related Posts Plugin for WordPress, Blogger...